I am pleased to announce the release of taxburst 0.3.0. taxburst is intended to be a maintained and extensible update the venerable Krona software, which is used for interactive exploration of metagenome/microbiome taxonomy.
taxburst is developed on github at github.com/taxburst/taxburst, and is available via PyPI at pypi.org/project/taxburst/. The documentation is at taxburst.github.io/taxburst/.
The tl;dr is that taxburst is now a tested and released package that natively supports sourmash, SingleM, and krona input formats, while retaining all of the same functionality as the original Krona.
Moreover, taxburst has flexible internals written in Python3, supports input/output in a programmatically accessible JSON format, uses Jinja templating to produce the final XHTML output, and supports some small extensions to the per-node information display.
So, y'know, give it a try!
BTW, it all looks exactly like Krona (because it is ;)). Here's a screenshot:
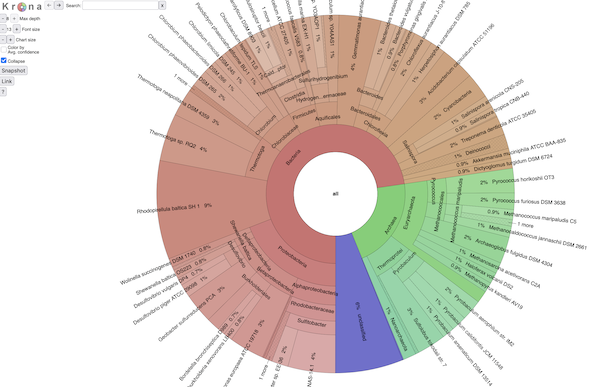
and if you want to explore an interactive view of a SingleM analysis,
click here.
Here I would especially like to thank two of the original Krona developers, Brian Ondov and Adam Philippy, who have been very supportive of this fork. They noted that between mash (=> sourmash) and Krona (=> taxburst) I have somewhat of a history of building off of their good ideas and software, and we have all agreed that at some point in the future there will be an exchange of beer-like substances :).
It all started with some tests...
So... why taxburst??
Over in sourmash#3711, I updated sourmash to be more consistent around using weighted k-mers to assign taxonomy; some of our taxonomy output formats do so by default, while others didn't. This caused a certain amount of confusion, and so I set out to fix it.
Midway through the PR I started to get an itchy feeling, because I wasn't sure how to test the output formats properly. Visually they looked fine, but that doesn't cut it when outputting formats for other programs! I also generally get nervous when I don't have automated tests for new code.
We also needed some improved visualization options, motivated by a workshop (MBL STAMPS) that I was involved in.
And one of the best interactive visualizations I've seen for taxonomy is the Krona visualization system. Krona parses the krona input format, which, coincidentally, is a format also produced by sourmash, and was one of the formats that I wanted to test.
So I decided to look into running the Krona software
...but Krona isn't maintained, and I couldn't figure out how to support GTDB.
The Krona software was last updated about 5 years ago, and while I could find lots of piecemeal documentation online, it wasn't particularly straightforward to figure out how to run it.
Moreover, I couldn't find any standard approach to using the GTDB taxonomy with Krona; most of the parsing scripts seemed to need the NCBI taxonomy for producing the right hierarchy.
On the flip side, the XHTML document produced by Krona was very easy to understand. It's a beautifully written and documented set of JavaScript and XHTML that contains all of the "business" side of Krona - the interactive exploration functionality.
So I decided to dive into writing my own frontend that would parse multiple input formats and produce the normal Krona output document.
So anyway, taxburst was born.
I decided to fork Krona (since it's under the 3-clause BSD license, this was easy!) and try implementing some of my desired functionality.
I named it 'taxburst' because the chart that Krona produces is called a "sunburst chart".
taxburst started like most of my projects: a pile of minimally functional scripts that I'd forced into coherence. Over the last few weeks I've added Python project support & package structure, automated tests, and a documentation site.
Parsing, testing, and JSON formats.
Other than a nice, simple piece of software that produces exactly the figure I wanted, taxburst also helped me with a few other things.
First, during the STAMPS course, SingleM was published. SingleM is a really nice approach to examining the unknown bacterial and archaeal bits of metagenomes, and I was able to whip up a SingleM parser for taxburst.
Second, I built taxburst around a simple Python tree format that uses nested dictionaries. This turned out to be easy to export to JSON. And, of course, once it's easy to export a programatically accessible format, it's easy to play with that format, too. So I built a simple validation workflow for sourmash taxonomy formats that uses sourmash to output a few different taxonomic summaries, and then uses taxburst to turn them into JSON, at which point custom scripts compare the JSON.
I wouldn't say I put a few weeks into developing taxburst just so that I could test sourmash better, but that's not entirely wrong, either. It was definitely a nice outcome :).
Once other particularly nice outcome is that (in theory, at least) people don't have to write parsers for their own preferred formats in Python - they can use any language that can output JSON. I provide some simple instructions here.
I am also exploring the idea of building a plugin framework for input format parsing for taxburst, so that people can write their own parsers without having to contribute them to taxburst. That seems like overkill at the moment tho.
Last but not least, it looks like there are some nice unpublished extensions to Krona that we can maybe integrate and make useful for others! Super cool.
Future thoughts for taxburst
I added some minimal support for additional custom attributes on nodes. I'd love to expand that.
I'd love to rewrite the XHTML data format used internally to instead use JSON, which would then more easily support clever JavaScript extensions.
I'm by no means a JavaScript programmer, but it seems like taxburst is now ripe for customization and extension in JavaScript, which could lead in some nice UX directions.
Pull requests are very welcome! I put taxburst under its own GitHub organization so that it was separate from the dib-lab and the sourmash-bio organizations, as a way of indicating that I am open to whatever development and maintenance approaches make sense moving forward. I doubt taxburst is going to be some big exciting project, but I definitely want to support community engagement to whatever extent makes sense.
Enjoy!
--titus
Appendix: after the fact
After I wrote this blog post, Tessa Pierce-Ward pointed out that she'd written a whole blog post about sourmash and Krona back in 2021 - that would have pointed me in a completely different direction. I'm still happy with taxburst tho :)
There are comments.