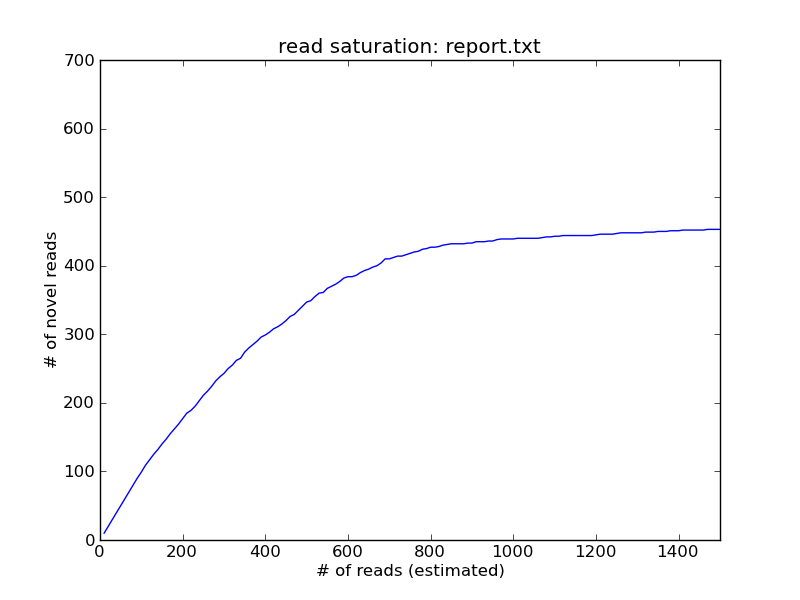
This recipe provides a time-efficient way to determine whether you've saturated your sequencing depth, i.e. how much new information is likely to arrive with your next set of sequencing reads. It does so by using digital normalization to generate a "collector's curve" of information collection.
Uses for this recipe include evaluating whether or not you should do more sequencing.
This approach is more accurate for low coverage than normalize-by-median's reporting, because it collects the redundant reads rather than discarding them.
Note: at the moment, the khmer script normalize-by-median.py needs to be updated from the master branch of khmer to run this code properly. Once we've cut a new release, we'll remove this note and simply specify the khmer release required.
Let's assume you have a simple genome with some 5x repeats, and you've done some shotgun sequencing, and you want to know whether or not you've saturated to a coverage of 5 with your sequencing. You can use a variant of digital normalization, saturate-by-median, to run a collector's curve:
~/dev/khmer/sandbox/saturate-by-median.py -x 1e8 -k 20 -C 5 -R report.txt --report-frequency 10 reads.fa
Then, plot the resulting saturation curve:
./plot-saturation-curve.py report.txt saturation.png --xmin 0 --ymin 0 --xmax 1500

The x axis here is the number of reads examined (column 1 in report.txt), while the y axis (column 2) is the number of reads that are below a coverage of 5 in the data set at that point. You can see here that by the time you had sampled 1000 reads, you'd stopped seeing new coverage=5 reads, which suggests that further sequencing is unnecessary.
If you zoom out on the graph, you'll see that the curve keeps on climbing, albeit much more slowly. This is due to the influence of error rate on prediction of "novel" reads, and is something we have to fix.
Resources and Links
This recipe is hosted in the khmer-recipes repository, https://github.com/ged-lab/khmer-recipes/.
It requires the khmer software.
Comments !