The below is a recipe for subsetting a high-coverage data set to a given average coverage. This differs from digital normalization because the relative abundances of reads should be maintained -- what changes is the average coverage across all the reads.
Uses for this recipe include subsampling reads from a super-high coverage data set for the purpose of assembly, as well as more esoteric reasons (see the bottom of the post). This approach won't work on digitally normalized reads, and is primarily intended for genomes and low-complexity metagenomes. For high-complexity metagenomes we recommend partitioning.
Note: at the moment, the khmer scripts collect-reads.py and slice-reads-by-coverage.py are in the khmer repository under branch feature/collect_reads. Once we've merged it into the master branch and cut a release, we'll remove this note and simply specify the khmer release required.
This recipe uses code from khmer-recipes and dbg-graph-null.
Let's assume you have a simple genome with some 5x repeats, and you've done some shotgun sequencing to a coverage of 150 or higher. If your reads are in reads.fa
load-into-counting.py -x 1e8 -k 20 reads.kh reads.fa
~/dev/khmer/sandbox/calc-median-distribution.py reads.kh reads.fa reads-cov.dist
./plot-coverage-dist.py reads-cov.dist reads-cov.png --xmax=600 --ymax=500
and looks like this:
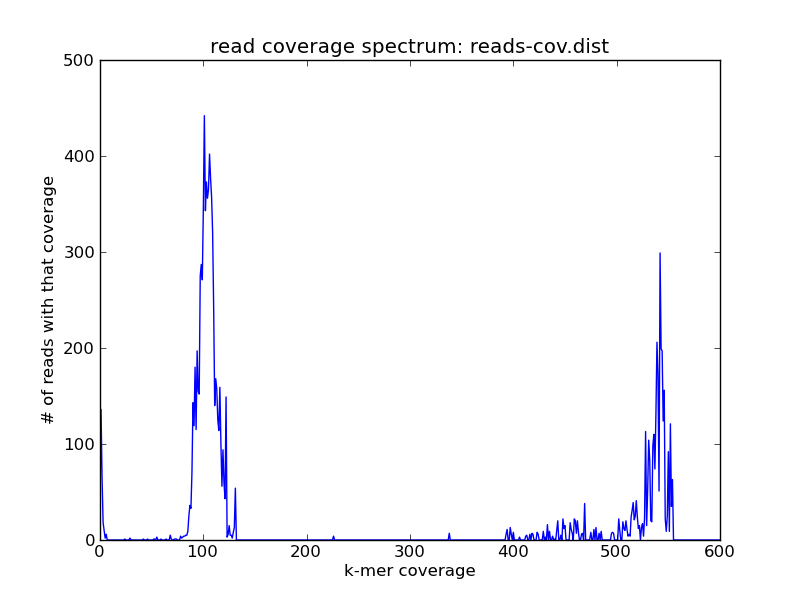
You see the same peaks at roughly the same places.
Now use collect-reads.py to subset the data to a lower average coverage of 50
~/dev/khmer/sandbox/collect-reads.py -x 1e8 -C 50 -k 20 reads.subset.kh reads.fa -o reads.subset.fa
Here, collect-reads.py is walking through the data set and computing a running average of the coverage of the last 1000 reads. Once it hits the specified average coverage of 50 (-C 50) it stops collecting the reads. Take a look at the read coverage spectrum for the subsetted data:
~/dev/khmer/sandbox/calc-median-distribution.py reads.subset.kh reads.subset.fa reads-subset.dist
./plot-coverage-dist.py reads-subset.dist reads-subset.png --xmax=600 --ymax=500
and compare the resulting plot with the one above --
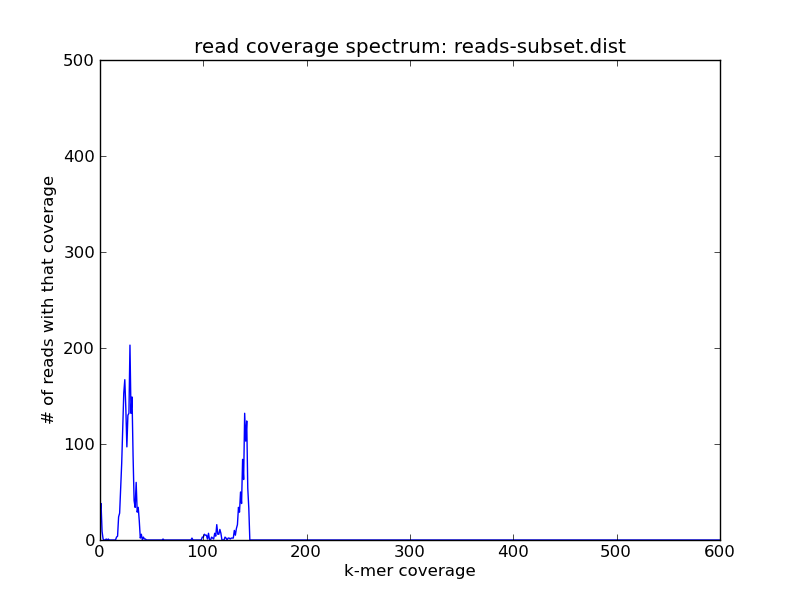
Here you can see that the coverage spectrum has been shifted left and down by the subsampling (which is what you'd expect).
Note that picking the coverage that you want is a bit tricky, because it will be the average across the reads. If you have a highly repetitive genome you may need to go for something higher than your desired single-copy genome coverage, because the repeats will skew your average to the right.
Esoterica
If the peaks look good, you can use the output counting table reads.subset.kh as an argument to slice-reads-by-coverage (see this post). If you use the original reads, this will then give you _all_ the reads that cluster by coverage with that peak. For example,
~/dev/khmer/sandbox/slice-reads-by-coverage.py reads.subset.kh reads.fa reads-repeats.fa -m 100 -M 200
will give you all the reads from the repetitive component, which will be much higher coverage in the combined data set; take a look:
load-into-counting.py -x 1e8 -k 20 reads-repeats.kh reads-repeats.fa
~/dev/khmer/sandbox/calc-median-distribution.py reads-repeats.kh reads-repeats.fa reads-repeats.dist
./plot-coverage-dist.py reads-repeats.dist reads-repeats.png --xmax=600 --ymax=500
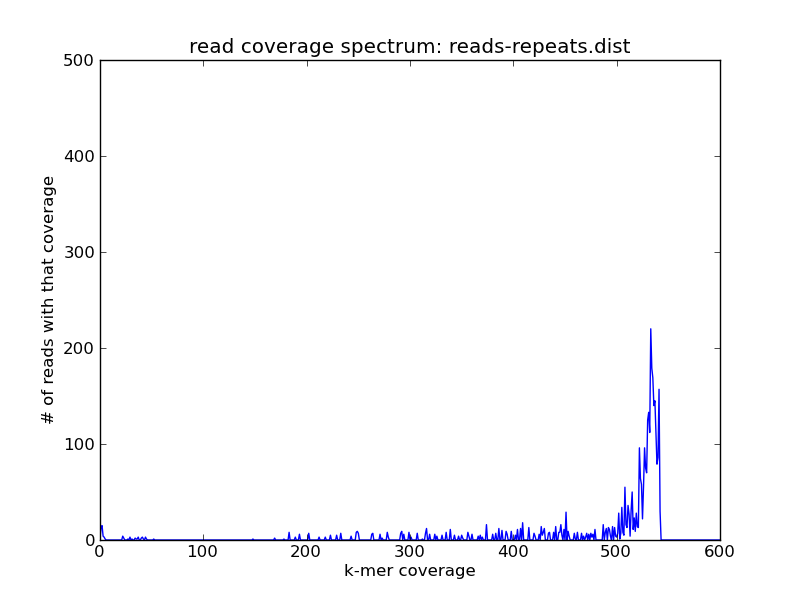
Here the slice specified (-m and -M) is with respect to the read abundances in reads.subset.kh). This allows you to more explore and subset large data sets than you would otherwise be able to, and also avoids some khmer-specific issues with counting k-mers that are higher abundance than 255.
Comments !