(This project is a collaboration with Jason Pell and Adina Howe)
A few weeks ago I posted about a k-mer filtering approach that we were using to remove low-abundance k-mers from metagenomic data sets, prior to assembly. This technique is working well, and we've managed to do some assembly of soil data sets. Our next challenge there is figuring out how to evaluate the quality of the assembly!
At the time of this previous post, I said
... any sequence arising as the result of a sequencing error is going to be extremely rare ...
and the mental model we've been using for filtering was that since Illumina reads are error-prone -- especially on the 3' side -- removal of sequences containing low abundance k-mers would help screen out sequences containing errors. The logic here is that if you break a sequence, like
atggAgtac
down into (say) 4-mers,
atgg
 tggA
  ggAg
   gAgt
    Agta
     gtac
and there was a single sequencing error (the 'A') in the original sequence, then all four k-mers containing the 'A' would be at low abundance in the data set. Set k=32 and you see the potential for lots and lots of low-abundance k-mers.
So I figured that the dominant effect of k-mer filtering would be removal of erroneous sequence.
It turns out I was dead wrong, and that we're actually just removing genuinely low-abundance sequences, presumably from genuinely low-abundance DNA present in the sample we're sequencing. But we took a circuitous route to get there. This is that story.
The k-mer abundance profile problem
We're interested in two things: first, eliminating reads with early errors in them; and second, trimming reads to remove the error-prone 3' end. For read trimming, we didn't know where to start trimming, so we figured that we could develop an empirical threshold by looking at the k-mer abundance profile across the read, and then choosing a point in the reads that initiated a run of a lot of low-abundance k-mers. This would be the place where the Illumina sequencing was breaking down.
So we plotted the summed abundance of 32-mers across the entire data set against their position in reads using our khmer magic, and got the green line on the following plot:
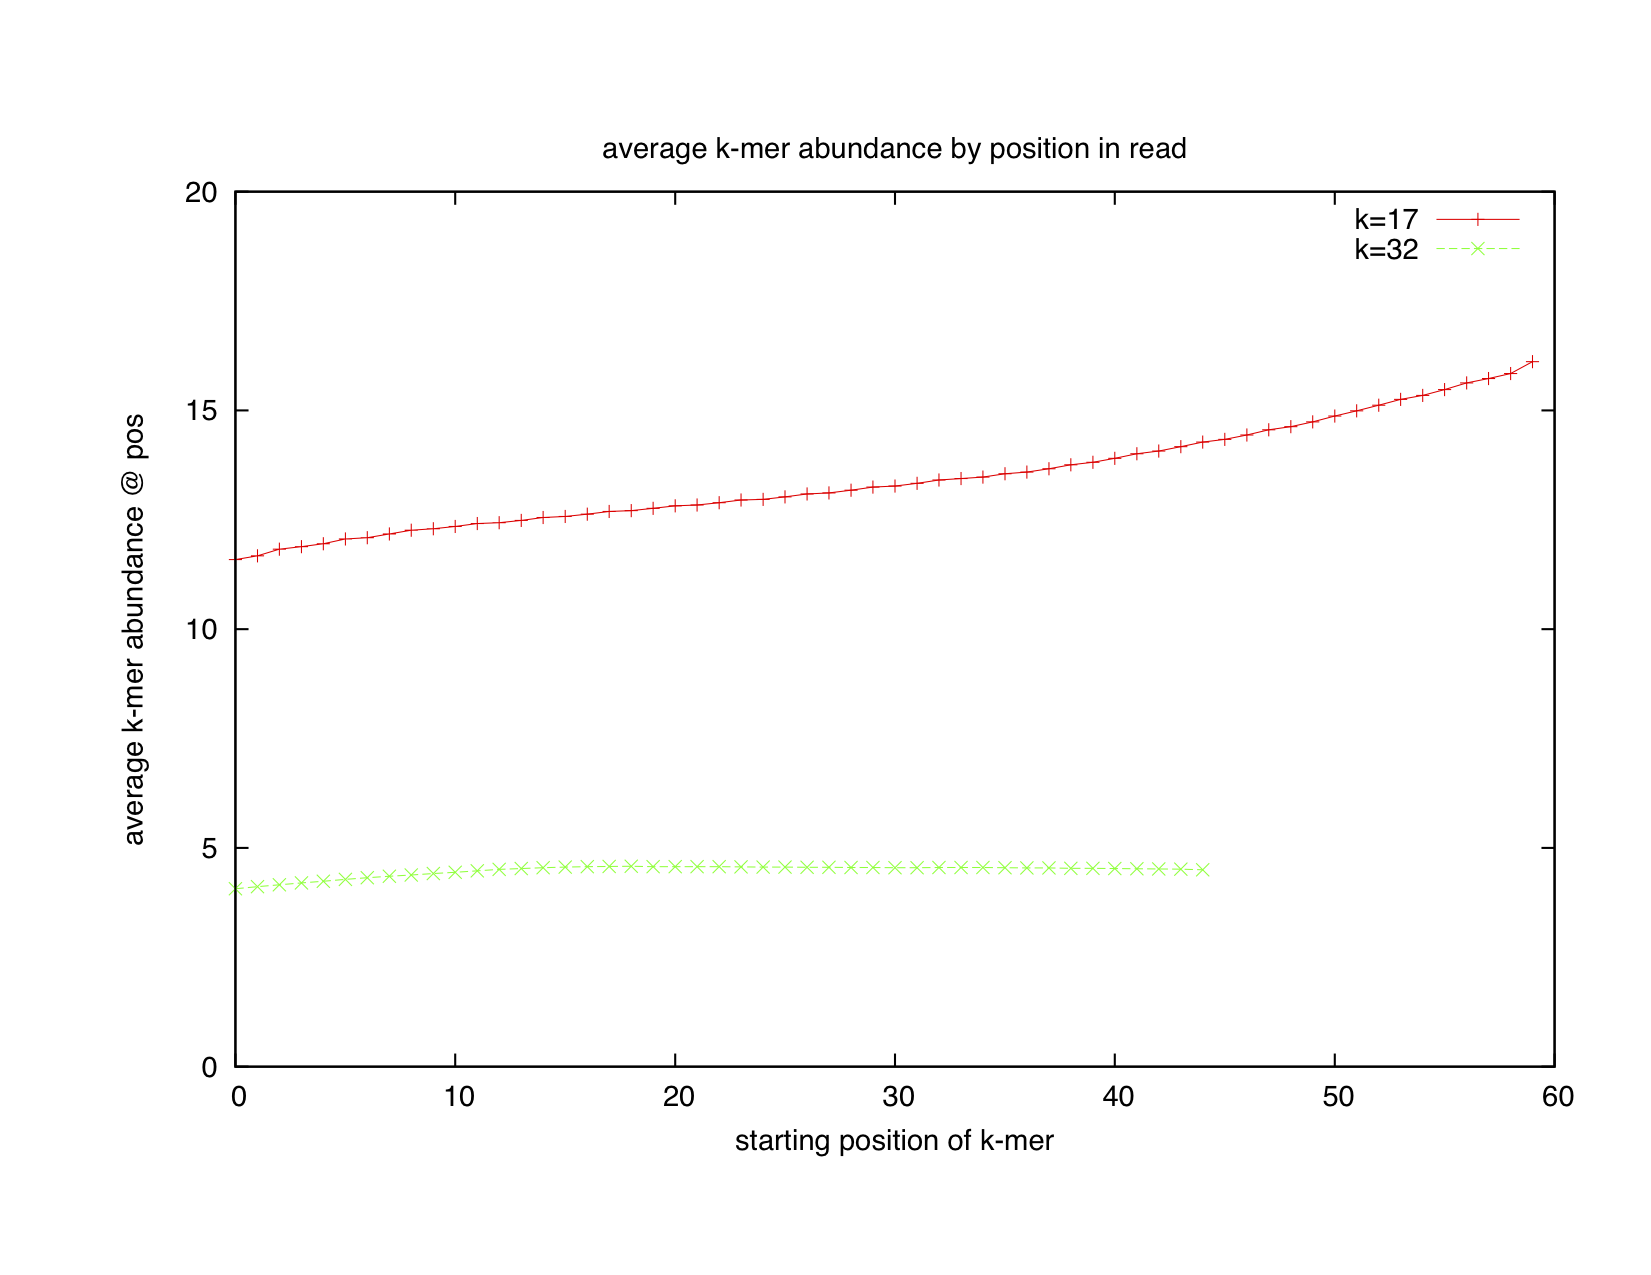
OK, the green line doesn't show any drop in average abundance, so maybe we won't be able to trim using low-abundance k-mers as a signal for dropping quality. Minorly surprising but not stunning.
Unfortunately, Jason also plotted the average abundance of 17-mers -- red line, above plot.
It rises continuously throughout the read, suggesting that Illumina reads trend towards high-abundance 17-mers at their 3' end. WTF??
...this is not at all what you'd expect if errors were causing novel k-mers to appear at the end of reads.
Looking between the two graphs, we immediately suspected that homopolymer runs were popping up. That is, at the end of reads, erroneous runs of AAAAAA.... or CCCCC... etc. were read off by the Illumina sequencer or base calling system, resulting in a lot of low-complexity subsequences. For small k (=17), this would result in lots and lots of identical 17-mers; for larger k (=32), the homopolymer runs would be connected to more unique sequence earlier in the read and the 32-mers wouldn't all be unique.
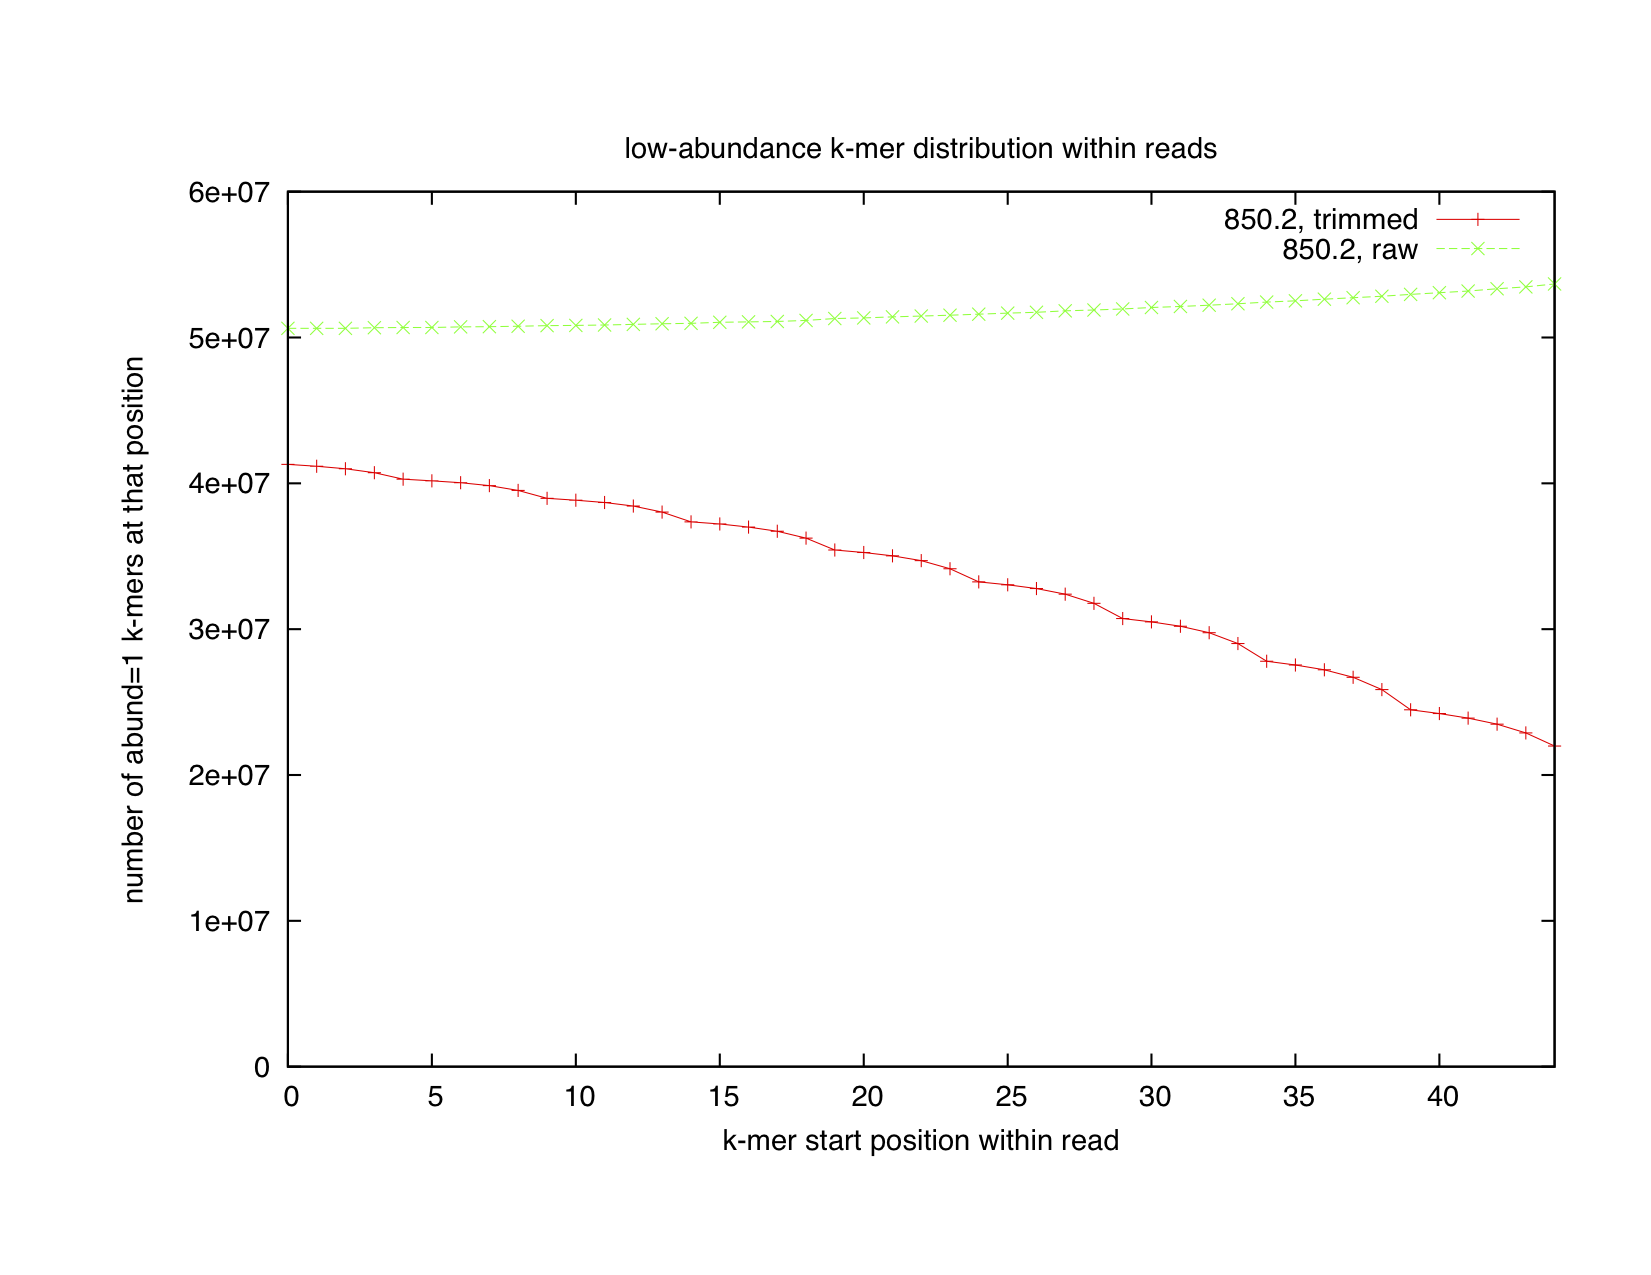
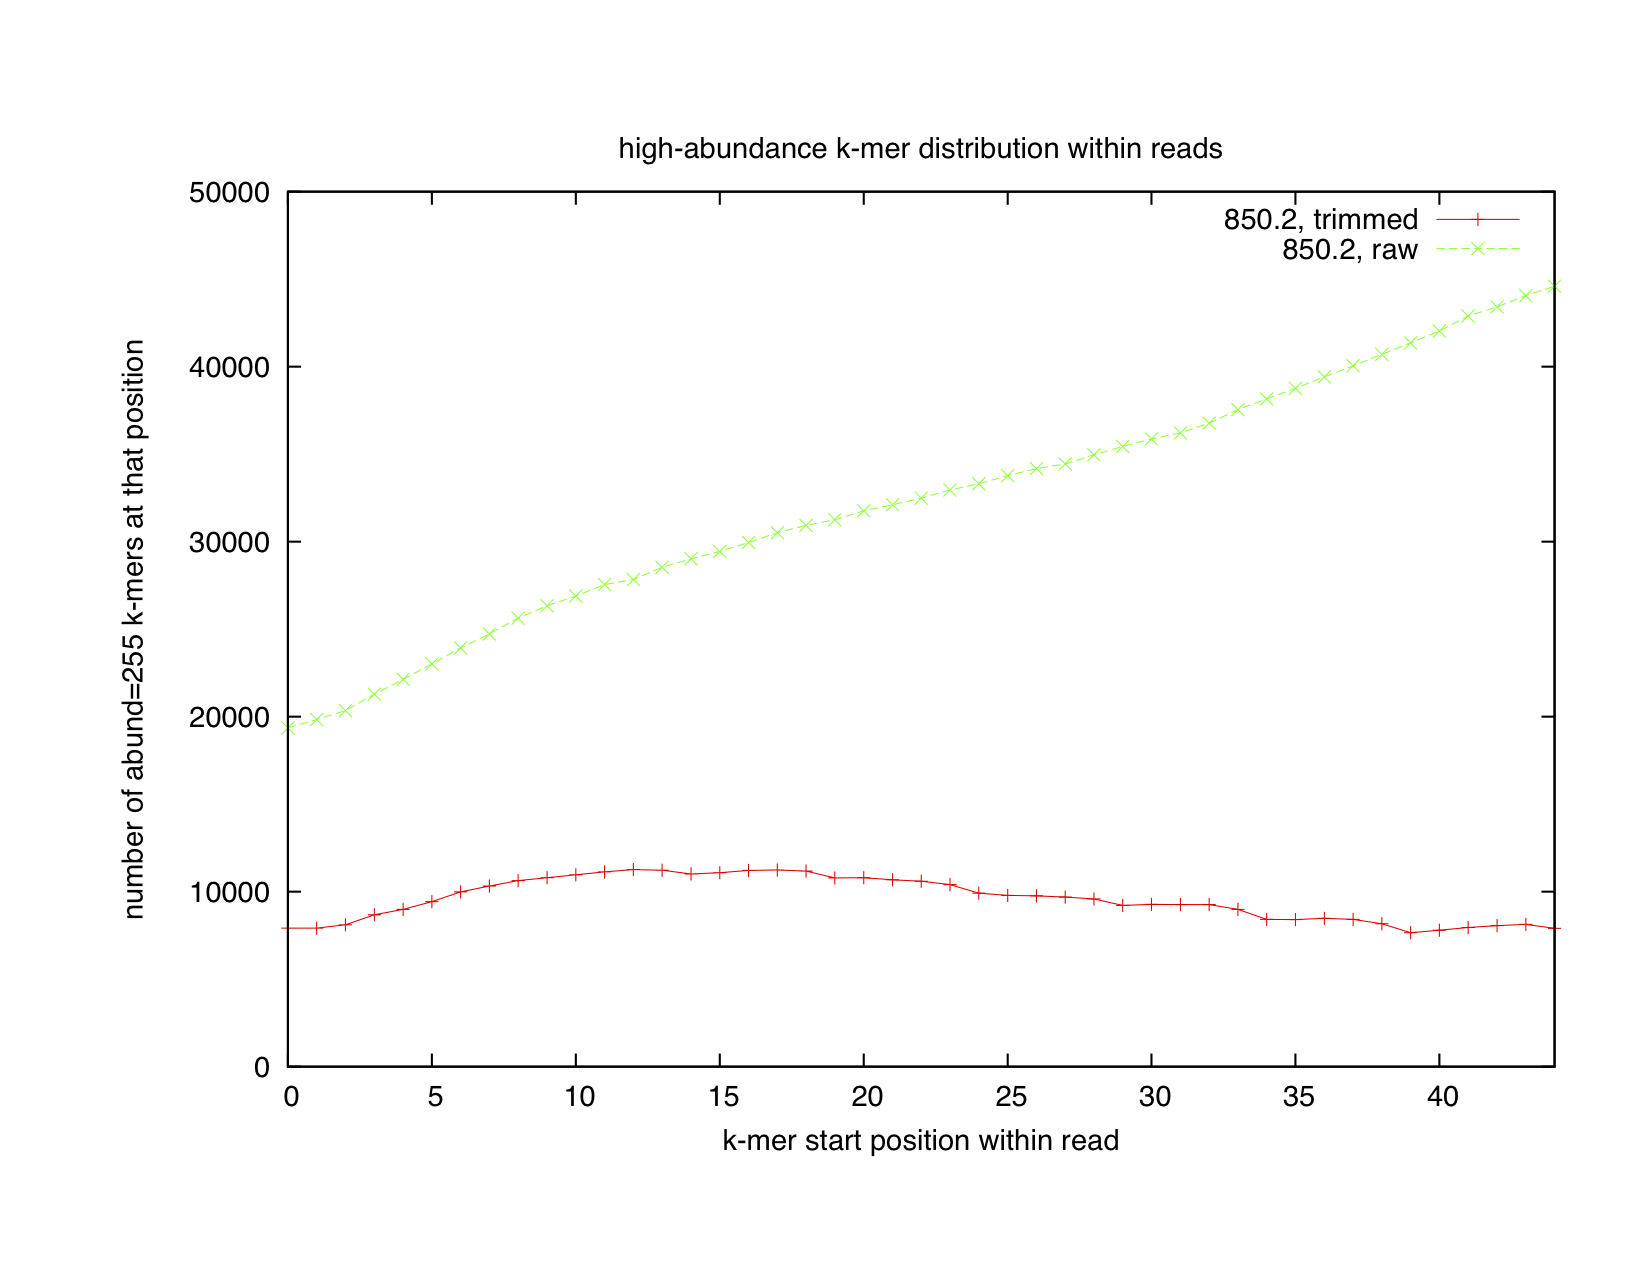
To track this down, we first decided to look at the distribution of low (abundance = 1) and high (abundance >= 255) abundance k-mers across reads.
High- and low-abundance kmers, by position
When we looked at where unique k-mers tended to lie in the read, we found that there was a nearly uniform distribution of them (first graph, green line). Sure, there's a small uptick at the end, but if you look at the left axis, you can see that it's only about 10% -- not at all what you'd expect if the reads were very error-prone at the 3' end. The real signal is in the high-abundance k-mers, which have a huge predisposition to being at the 3' end of the read (second graph, green line). This suggested that our homopolymer mechanism for explaining the rise of the summed 17-mer abundances towards the 3' end of the reads was correct -- and, indeed, when we went in and looked at what exact sequences were present in high abundance, we saw a bunch of homopolymer runs.
We verified that these high-abundance k-mers were predominantly homopolymer runs by using our Mark 1 Eyeball Detection System; here's the top of the list of abundance >= 255 k-mers:
ACAATGGATCAACAACGACAATGGATCAACAA
TGAGGCGGGGGTCACCCTGAGGCGGGGGTCAC
AATCTCATGCCTCAGCCAATCTCATGCCTCAG
CCCCCCCCCCCCCCCCCCCCCCCCTCCCCCCC
AAACCAAAAAAAAAAAAAAACAAAAAAAAAAA
GATCGGAAGAGCGGTTCAGCAGGAATGCCGAG
GGGGGGGGGGGGGAGGGGGGGGGGGGGGGGAC
AAAAAAACAAAAAAAAACAAAAAACAAAAAAA
GGGGGGGGGCGGGGGGGGGGGGGGGGGGGGGG
CACCGTAGGCACCTTGGCACCGTAGGCACCTT
GGGGGGGGGGGGGGGGGGGGAGGGGGGGGGGG
AGAGTGTAGATCTCGGTGGTCGCCGTATCATT
GGGGGGGGGGGGGGGGGGGGGGGGGGGGTGGG
TGTAGGGAAAGAGTGTAGATCTCGGTGGTCGC
CTCCCCCCCCCCCCCCCCGCCCCCCCCCCCCC
GCGGGGGGGGGGGGGGGGCAGGGGGGGGGGGG
CCACCCCCCCCCCCCCCCCCCCCCCCCCCCCC
CCCCCCTCCCCCCCCCCCCCCCCCCCCCCCCC
CCCCCCCCCCCGCCCCCCCCCCCCCCCCCCCC
AAAAAAAAAAACCAAAAAAAAAAAAAAAACAA
AAAAAAACAAAAACAAAAAAAAAAAAAAAACA
GGGGGGGGGGGGGGGGGGGGGGGGGGGGCGGG
CGGAAGAGCGTCGTGTAGGGAAAGAGTGTAGA
CCCCCCACCCCCCCCACCCCCCCACCCCCCCC
GGGGGGGGGGGGGGCGGGGGGCGGGGGGGGGC
So, in the raw reads from the sequencing facility, we see a lot of homopolymer runs on the 3' end, and not much in the way of unique k-mers (indicating that there's very little single-base error.)
Trimming reads by error scores
At this point, our work on k-mers converged with some work that Adina was doing. She was looking at trimming by quality score; the more recent base calling system used by Illumina puts in phred-score=2 markers at positions within the read where the sequence quality has deteriorated to the point where it shouldn't be trusted any more. We decided to see if trimming all sequences at such positions would lead to "better" (more uniform) k-mer distributions. We therefore looked at the low- and high-abundance k-mer distributions, as above, but for quality-trimmed sequence. We got the red lines in the plots above.
For the high-abundance k-mers, we see a near-perfect leveling of the k-mer abundance distribution in the quality-trimmed reads. This indicates that the Illumina phred-score=2 prediction is working nearly perfectly for predicting the start of poor sequence stretches, as indicated by homopolymer runs. This distribution is more or less what you'd expect of good-quality sequence.
The distribution of low abundance k-mers, however, is much more puzzling. Unique k-mers are dropping in number as reads get longer. This shouldn't happen unless the 5' end of the read is much more error-prone than the 3' end -- generally not what you'd expect! The explanation for this phenomenon may be that Illumina is over-trimming the reads: that is, in an effort to get rid of low-quality sequence, they're putting in a bias against good quality scores at the 3' end of their reads. This results in a systematic over-trimming of reads by our program, and my guess is that we're probably throwing away some good sequence here. (A casual conversation with an Illumina representative at a recent conference suggests that this is in fact what's going on.)
K-mer abundance histogram
The suspicious among you might note the decline in the red lines (trimmed data) on the right side of the low- and high-abundance k-mer graphs, and period-5 bounciness in the same red lines. Are we just getting rid of long reads in the trimming process? And whence the bounciness? Well, first, most of the reads remain untrimmed, so we can't account for declining signal; and the periodicity is actually caused by a periodicity in the length distribution of the trimmed reads:
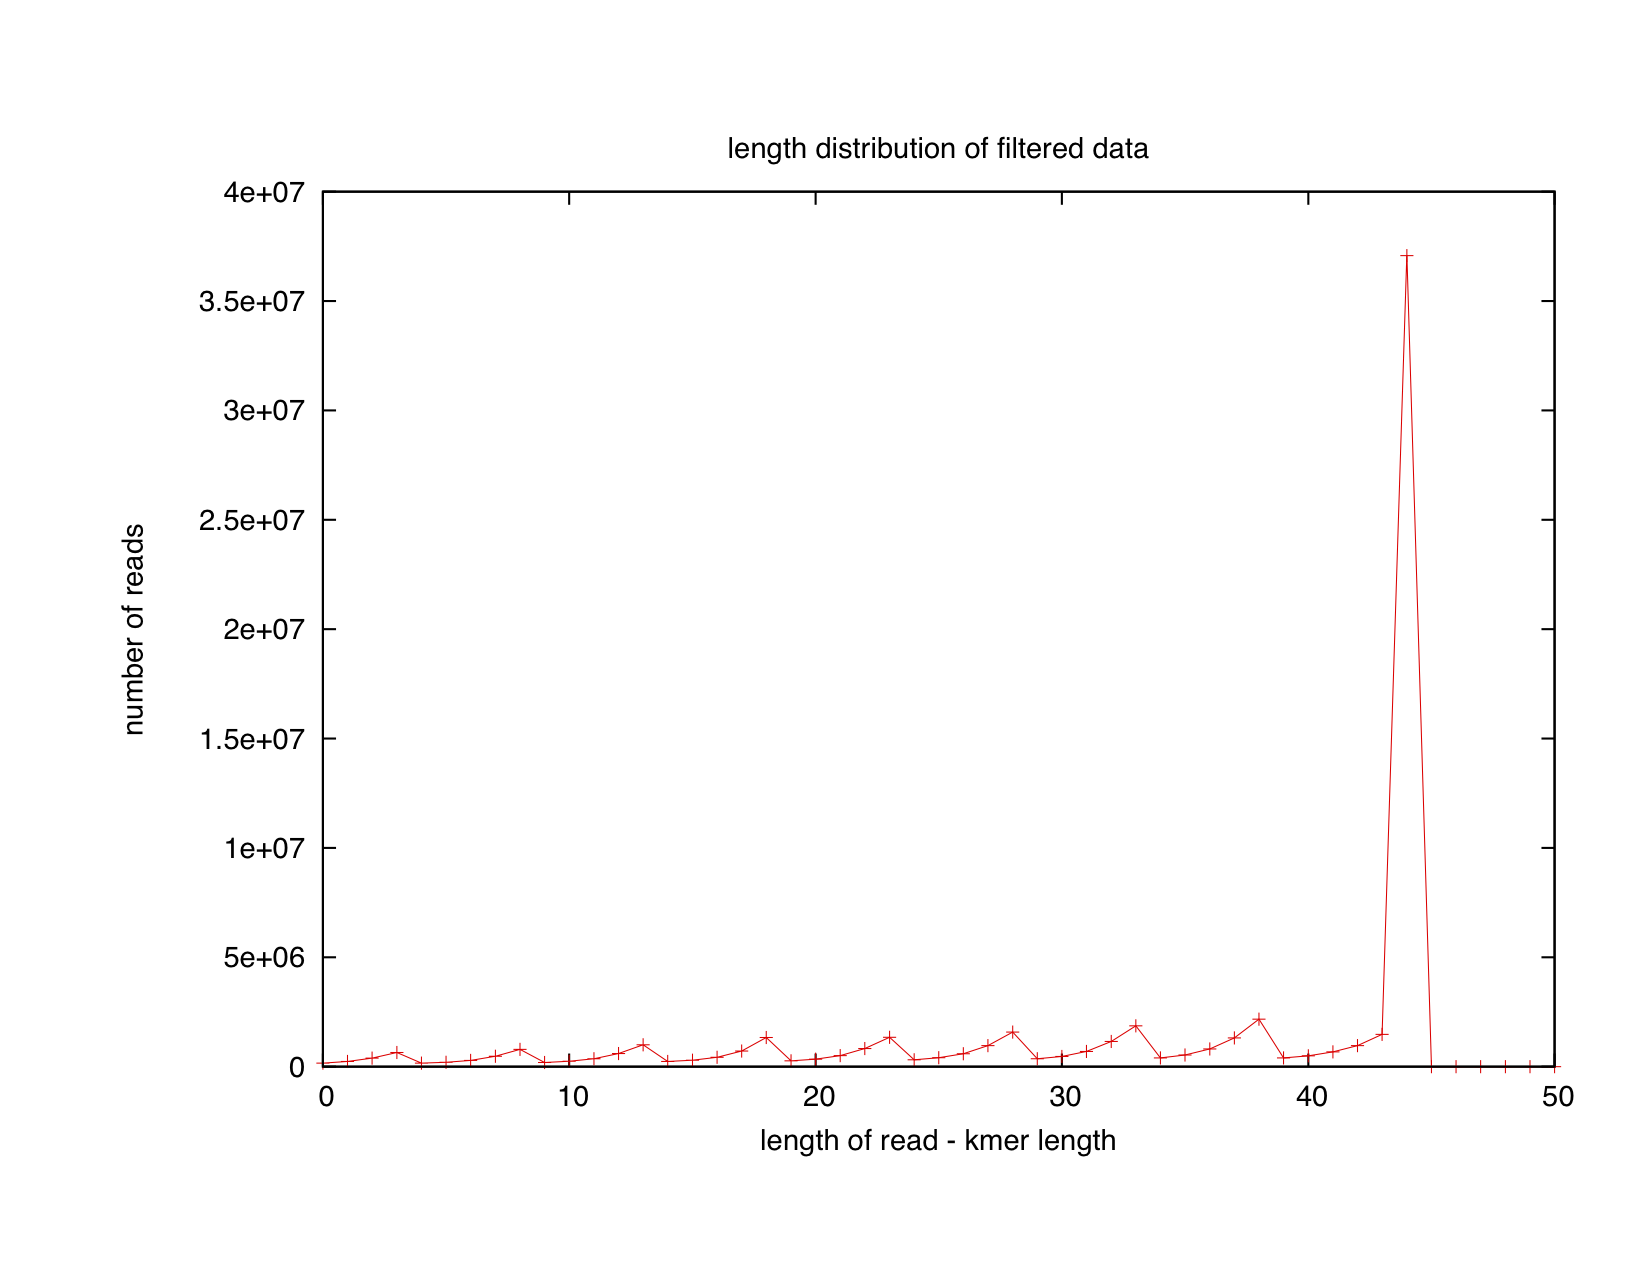
(This graph is actually by # of k-mers at each position, not by read length; add 31 to the bottom axis for technical correctness.)
It's interesting to look at the periodicity in the trimmed reads. It gives us some insight into the Illumina quality score calculation code: there must be some Illumina error calculation system that is dependent on blocks of five bases, although why they suggest trimming at positions that are exact multiples of five is an interesting question.
The homopolymer issue
So, it seems that Illumina reads are actually more prone to homopolymer runs than anything else, AND the per-base error rate is low enough to not result in lots and lots of unique k-mers.
This has some interesting implications for assemblers. In particular, you definitely want to trim 3' ends of Illumina reads before assembly, because otherwise assemblers might choke on the homopolymer runs. You certainly don't want to be paying attention to the homopolymer sequence!
I'd really like to take a look at k-mer abundances across 454 reads. Soon, perhaps.
Conclusions
My main conclusion from all of this is: in our data set, unique k-mers are not predominantly caused by errors. Rather, they are simply low-abundance reads from a complex population. There's therefore no scientific point to removing reads containing low-abundance k-mers, or trimming reads at the first unique k-mer. It's simply a way to remove data so as to favor high-abundance organisms, which might be more assemblable. (Which is fine, but it should be explicitly understood!)
This conclusion is almost certainly not true of lower-complexity samples, like mRNAseq, ChIP-seq, or genome resequencing.
A secondary conclusion is that k-mer abundance analysis is an excellent way to look for patterns within shotgun reads. Since patterns shouldn't generally be there, anything you see is suspicious and should be investigated further.
--titus
Appendix: the scripts
A pointer to some data, and all the scripts and code needed to generate the above graphs, is here:
http://github.com/ctb/khmer/blob/master/doc/blog-posts.txt
Legacy Comments
Posted by Nick Loman on 2010-08-04 at 13:50.
Sterling effort, and much to think about here. I routinely trim the 3'
ends of my sequences when doing de novo assemblies as per my tips here
(http://pathogenomics.bham.ac.uk/blog/2009/09/tips-for-de-novo-
bacterial-genome-assembly/) but you have helped me understand better
why this approach might be useful (other than just saying because the
qualities are low).     As per the comment on open science being hard
work - you could always stick this in Nature Precedings (they accept
things published on blogs) and at least can add it to the CV :)
Posted by Konrad Paszkiewcz on 2010-08-04 at 14:53.
Fascinating. I know Illumina looks at n bases before the scored base
to check for homopolymer runs. It could be that this is set to 5
(which seems a little short)    Do you observe the same periodicity
when trimming reads at a higher threshold (e.g. Q10 or Q20)?      Can
you say which version of SCS/pipeline was used to generate the quality
scores? I'll run your scripts on the latest SCS 2.8 pipeline once we
have it up and running.
Posted by Titus Brown on 2010-08-04 at 15:23.
@Nick, thanks!  That blog post of yours is very helpful!  And I'll
take a look at Nature Pre.  I was thinking PLoS One for the general
approach, actually.    @Konrad, this was from a the homegrown (?) JGI
pipeline.  I have access to some very recent Illumina soil data
directly from the company, too, but I've been waiting to get the raw
data.    Let me know if you need help with the scripts.  They're
obvious to me but, umm, we wrote them :)    I have a phone call with
some people at Illumina on Thursday so perhaps I'll have some more
information soon.
Posted by Brant Peterson on 2010-08-05 at 13:19.
@Konrad (& Titus--hey!) We've seen this base-5 periodicity in
reads "going to Bs" (dropping to illumina-scaled qualities of 2) and
(as far as I or scipy's fft implementation can tell) not at any higher
quality threshold.  For us, this looks like a special behavior of the
QV 2 call (which, as far as I understand, isn't really a quality score
so much as a vote of no confidence).  But just to stir the pot a
little, we've got some data from an older version of pipeline/RTA
(1.4/2.4?) where the reads all contained a common restriction site at
which no basecalls were made (not unexpected, the distributions of
intensities across all four channels are evidently taken into account
in quality assignment) BUT the odd part is that qualities increase
stepwise across reads going away from the restriction site--ALSO in
5bp windows for at least three visible jumps.  Somebody at Illumina
likes the number five? :)    I'd love to hear what you get from
Illumina about this! (And my vote, FWIW, is PLoS1!)
Posted by Jeremy Leipzig on 2010-08-05 at 14:45.
great analysis!    Did you find the 3' Illumina adaptor sequences in
your high abundance list? Like, AGATCGGAAGAGCGGTTCAGCAGGAATGCCGAGACCG?
Posted by Titus Brown on 2010-08-05 at 15:01.
post-phone call report: the period five stuff is expected (they're
using a window of 5, without sliding it, to judge QV=2 locations).
The loss of unique k-mer signal (red line, on low-abundance graph) is
more surprising.  They will get back to me if and when they can figure
out what it is.    @Brant, it sounds like a lot of work to write this
up for publication in a Real Journal... we have some bigger fish to
fry than this, although we'll have to see what happens re catching the
bigger fish before making a decision :)    cheers!    --titus
Posted by Titus Brown on 2010-08-05 at 15:01.
@Jeremy, didn't look yet... good Q though!
Comments !