(I gave a talk on this on Monday, April 11th - you can see the slides slides here, on figshare.
This is a Reproducible Blog Post. You can regenerate all the figures and play with this software yourself on binder.)
So, my latest enthusiasm is MinHash sketches.
A few weeks back, I had the luck to be asked to review both the mash paper (preprint here) and the MetaPalette paper (preprint here). The mash paper made me learn about MinHash sketches, while the MetaPalette paper made some very nice points about shared k-mers and species identification.
After reading, I got to thinking.
I wondered to myself, hey, could I use MinHash signatures to cluster unassembled Illumina RNAseq samples? While the mash folk showed that MinHash could be applied to raw reads nicely, I guessed that the greater dynamic range of gene expression would cause problems - mainly because high-abundance transcripts would yield many, many erroneous k-mers. Conveniently, however, my lab has some not-so-secret sauce for dealing with this problem - would it work, here? I thought it might.
Combined with all of this, my former grad student, Dr. Qingpeng Zhang (first author on the not-so-secret sauce, above) has some other still-unpublished work showing that the the first ~1m reads of metagenome samples can be used to cluster samples together.
So, I reasoned, perhaps it would work well to stream the first million or so reads from the beginning of RNAseq samples through our error trimming approach, compute a MinHash signature, and then use that signature to identify the species from which the RNAseq was isolated (and perhaps even closely related samples).
tl; dr? It seems to work, with some modifications.
For everything below, I used a k-mer hash size of 32 and only chose read data sets with reads of length 72 or higher.
(Here's a nice presentation on MinHash, via Luiz Irber.)
MinHash is super easy to implement
I implemented MinHash in only a few lines of Python; see the repository at https://github.com/dib-lab/sourmash/. The most relevant code is sourmash_lib.py. Here, I'm using a bottom sketch, and at the moment I'm building some of it on top of khmer, although I will probably remove that requirement soon.
After lots of trial and error (some of it reported below), I settled on using a k-mer size of k=32, and a sketch size of 500. (You can go down to a sketch size of 100, but you lose resolution. Lower k-mer sizes have the expected effect of slowly decreasing resolution; odd k-mer sizes effectively halve the sketch size.)
How fast is it, and how much memory does it use, and how big are the sketches?
I haven't bothered benchmarking it, but
- everything but the hash function itself is on Python;
- on my 3 yro laptop it takes about 5 minutes to add 1m reads;
- the memory usage of sourmash itself is negligible - error trimming the reads requires about 1 GB of RAM;
- the sketches are tiny - less than a few kb - and the program is dominated by the Python overhead.
So it's super fast and super lightweight.
Do you need to error trim the reads?
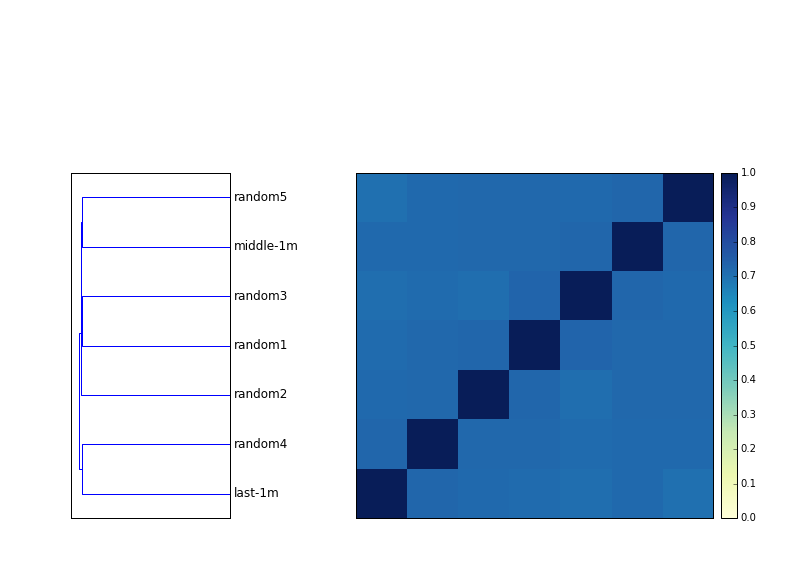
The figure below shows a dendrogram next to a distance matrix of 8 samples - four mouse samples, untrimmed, and the same four mouse samples, trimmed at low-abundance k-mers. (You can see the trimming command here, using khmer's trim-low-abund command.)
The two house mouse samples are replicates, and they always cluster together. However, they are much further apart without trimming.
The effect of trimming on the disease mouse samples (which are independent biological samples, I believe) is much less; it rearranges the tree a bit but it's not as convincing as with the trimming.
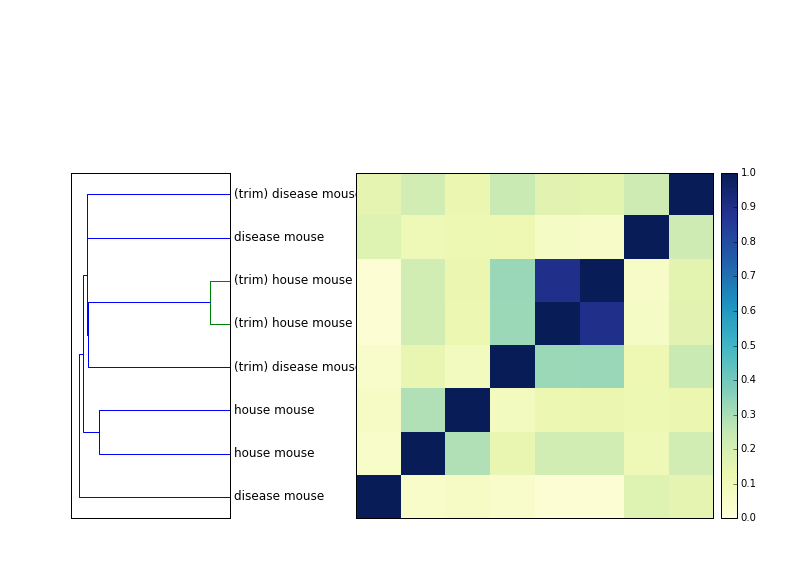
So you seem to get better resolution when you error trim the reads, which is expected. The signal isn't as strong as I thought it'd be, though. Have to think about that; I'm surprised MinHash is that robust to errors!
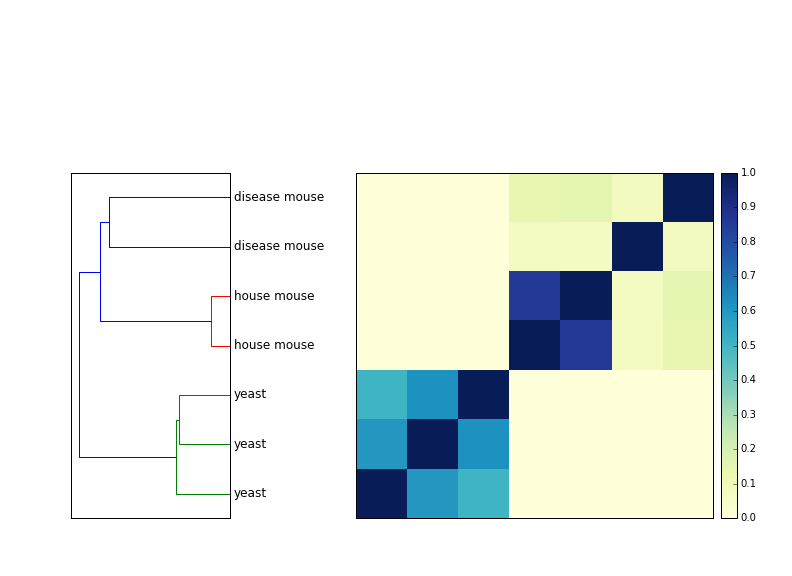
Species group together pretty robustly with only 1m reads
How many reads do you need to use? If you're looking for species groupings, not that many -- 1m reads is enough to cluster mouse vs yeast separately. (Which is good, right? If that didn't work...)
Approximately 1m reads turns out to work equally well for 200 echinoderm (sea urchin and sea star) samples, too.
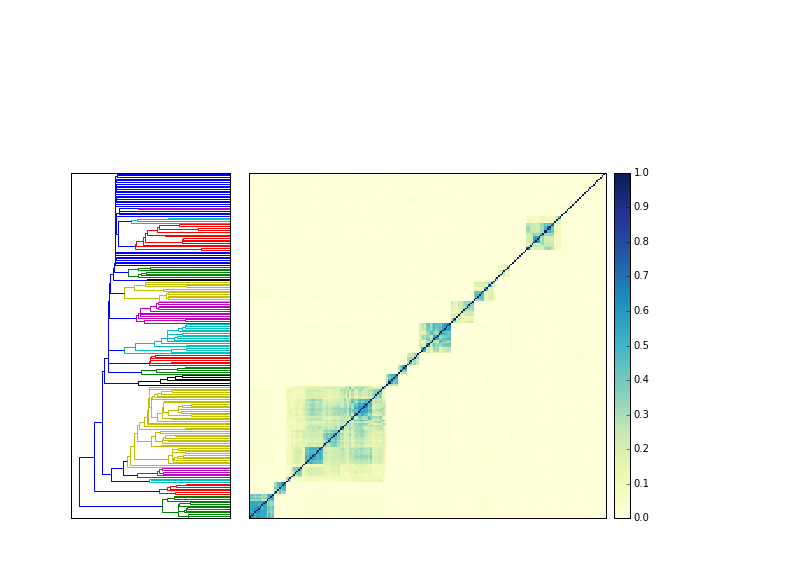
Here, I downloaded all 204 echinoderm HiSeq mRNAseq data sets from SRA, trimmed them as above, and computed the MinHash signatures, and then compared them all to each other. The blocks of similarity are all specific species, and all the species groups cluster properly, and none of them (with one exception) cluster with other species.
This is also an impressive demonstration of the speed of MinHash - you can do all 204 samples against each other in about 10 seconds. Most of that time is spent loading my YAML format into memory; the actual comparison takes < 1s!
(The whole notebook for making all of these figures takes less than 30 seconds to run, since the signatures are already there; check it out!)
Species that do group together may actually belong together
In the urchin clustering above, there's only one "confused" species grouping where one cluster contains more than one species - that's Patiria miniata and Patiria pectinifera, which are both bat stars.
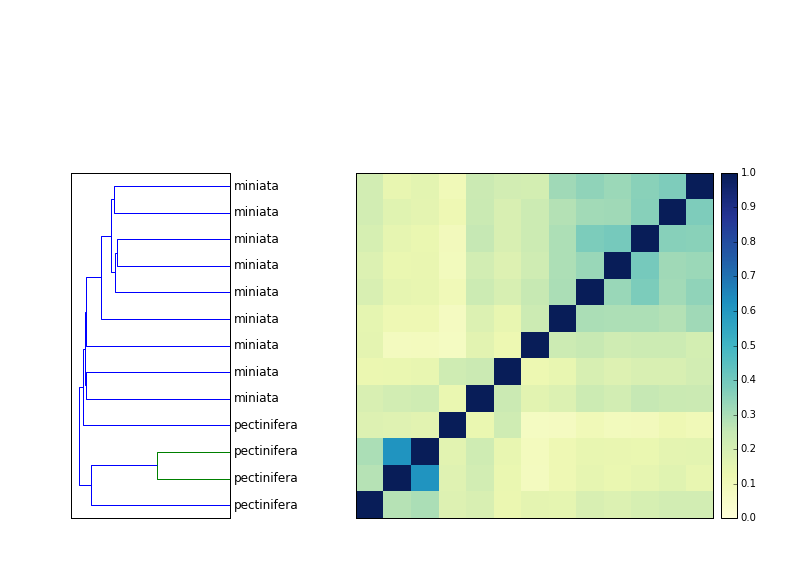
I posted this figure on Facebook and noted the grouping, and Dan Rokhsar pointed out that on Wikipedia, Patiria has been identified as a complex of three closely related species in the Pacific.
So that's good - it seems like the only group that has cross-species clustering is, indeed, truly multi-species.
You can sample any 1m reads and get pretty similar results
In theory, FASTQ files from shotgun sequencing are perfectly random, so you should be able to pick any 1m reads you want - including the first 1m. In practice, of course, this is not true. How similar are different subsamples?
Answer: quite similar. All seven 1m read subsamples (5 random, one from the middle, one from the end) are above 70% in similarity.
(Very) widely divergent species don't cross-compare at all
If you look at (say) yeast and mouse, there's simply no similarity there at all. 32-mer signatures are apparently very specific.
(The graph below is kind of stupid. It's just looking at similarity between mouse and yeast data sets as you walk through the two data streams. It's 0.2% all the way.)
Species samples get more similar (or stay the same) as you go through the stream
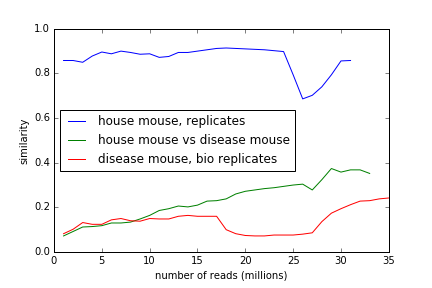
What happens when you look at more than 1m reads? Do the streams get more or less similar?
If you walk through two streams and update the MinHash signature regularly, you see either constant similarity or a general increase in similarity; in the mouse replicates, it's constant and high, and between disease mouse and house mouse, it grows as you step through the stream.
(The inflection points are probably due to how we rearrange the reads during the abundance trimming. More investigation needed.)
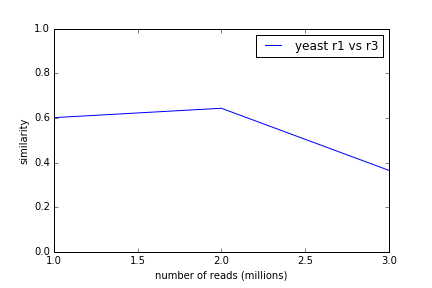
Yeast replicates also maintain high similarity through the data stream.
What we're actually doing is mostly picking k-mers from the transcriptome
(This is pretty much what we expected, but as my dad always said, "trust but verify.")
The next question is, what are we actually seeing signatures of?
For example, in the above mouse example, we see growing similarity between two mouse data sets as we step through the data stream. Is this because we're counting more sequencing artifacts as we look at more data, or is this because we're seeing true signal?
To investigate, I calculated the MinHash signature of the mouse RNA RefSeq file, and then asked if the streams were getting closer to that as we walked through them. They are:
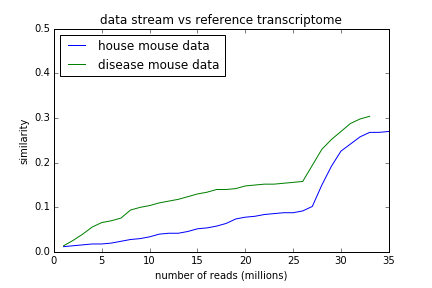
So, it seems like part of what's happening here is that we are looking at the True Signature of the mouse transcriptome. Good to know.
And that's it for today, folks.
What can this be used for?
So, it all seems to work pretty well - the mash folk are dead-on right, and this is a pretty awesome and simple way to look at sequences.
Right now, my approach above seems like it's most useful for identifying what species some RNAseq is from. If we can do that, then we can start thinking about other uses. If we can't do that pretty robustly, then that's a problem ;). So that's where I started.
It might be fun to run against portions of the SRA to identify mislabeled samples. Once we have the SRA digested, we can make that available to people who are looking for more samples from their species of interest; whether this is useful will depend. I'm guessing that it's not immediately useful, since the SRA species identification seem pretty decent.
One simple idea is to simply run this on each new sample you get back from a sequencing facility. "Hey, this looks like Drosophila. ...did you intend to sequence Drosophila?" It won't work for identifying low-lying contamination that well, but it could identify mis-labeled samples pretty quickly.
Tracy Teal suggested that this could be used in-house in large labs to find out if others in the lab have samples of interest to you. Hmm. More on that idea later.
Some big remaining questions
- Do samples actually cluster by expression similarity? Maybe - more work needed.
- Can this be used to compare different metagenomes using raw reads? No, probably not very well. At least, the metagenomes I care about are too diverse; you will probably need a different strategy. I'm thinking about it.
One last shoutout
I pretty much reimplemented parts of mash; there's nothing particularly novel here, other than exploring it in my own code on public data :). So, thanks, mash authors!
--titus
Comments !